


Notebooks

Categories


Cells
Premium


BioTuring
Recent technological advancements have enabled spatially resolved transcriptomic profiling but at multi-cellular pixel resolution, thereby hindering the identification of cell-type-specific spatial patterns and gene expression variation.
To address this challenge, we develop STdeconvolve as a reference-free approach to deconvolve underlying cell types comprising such multi-cellular pixel resolution spatial transcriptomics (ST) datasets. Using simulated as well as real ST datasets from diverse spatial transcriptomics technologies comprising a variety of spatial resolutions such as Spatial Transcriptomics, 10X Visium, DBiT-seq, and Slide-seq, we show that STdeconvolve can effectively recover cell-type transcriptional profiles and their proportional representation within pixels without reliance on external single-cell transcriptomics references.
**STdeconvolve** provides comparable performance to existing reference-based methods when suitable single-cell references are available, as well as potentially superior performance when suitable single-cell references are not available.
STdeconvolve is available as an open-source R software package with the source code available at https://github.com/JEFworks-Lab/STdeconvolve .

BioTuring
Many spatially resolved transcriptomic technologies do not have single-cell resolution but measure the average gene expression for each spot from a mixture of cells of potentially heterogeneous cell types.
Here, we introduce a deconvolution method, conditional autoregressive-based deconvolution (CARD), that combines cell-type-specific expression information from single-cell RNA sequencing (scRNA-seq) with correlation in cell-type composition across tissue locations. Modeling spatial correlation allows us to borrow the cell-type composition information across locations, improving accuracy of deconvolution even with a mismatched scRNA-seq reference.
**CARD** can also impute cell-type compositions and gene expression levels at unmeasured tissue locations to enable the construction of a refined spatial tissue map with a resolution arbitrarily higher than that measured in the original study and can perform deconvolution without an scRNA-seq reference.
Applications to four datasets, including a pancreatic cancer dataset, identified multiple cell types and molecular markers with distinct spatial localization that define the progression, heterogeneity and compartmentalization of pancreatic cancer.

BioTuring
Build single-cell trajectories with the software that introduced **pseudotime**. Find out about cell fate decisions and the genes regulated as they're made.
Group and classify your cells based on gene expression. Identify new cell types and states and the genes that distinguish them.
Find genes that vary between cell types and states, over trajectories, or in response to perturbations using statistically robust, flexible differential analysis.
In development, disease, and throughout life, cells transition from one state to another. Monocle introduced the concept of **pseudotime**, which is a measure of how far a cell has moved through biological progress.
Many researchers are using single-cell RNA-Seq to discover new cell types. Monocle 3 can help you purify them or characterize them further by identifying key marker genes that you can use in follow-up experiments such as immunofluorescence or flow sorting.
**Single-cell trajectory analysis** shows how cells choose between one of several possible end states. The new reconstruction algorithms introduced in Monocle 3 can robustly reveal branching trajectories, along with the genes that cells use to navigate these decisions.
BioTuring
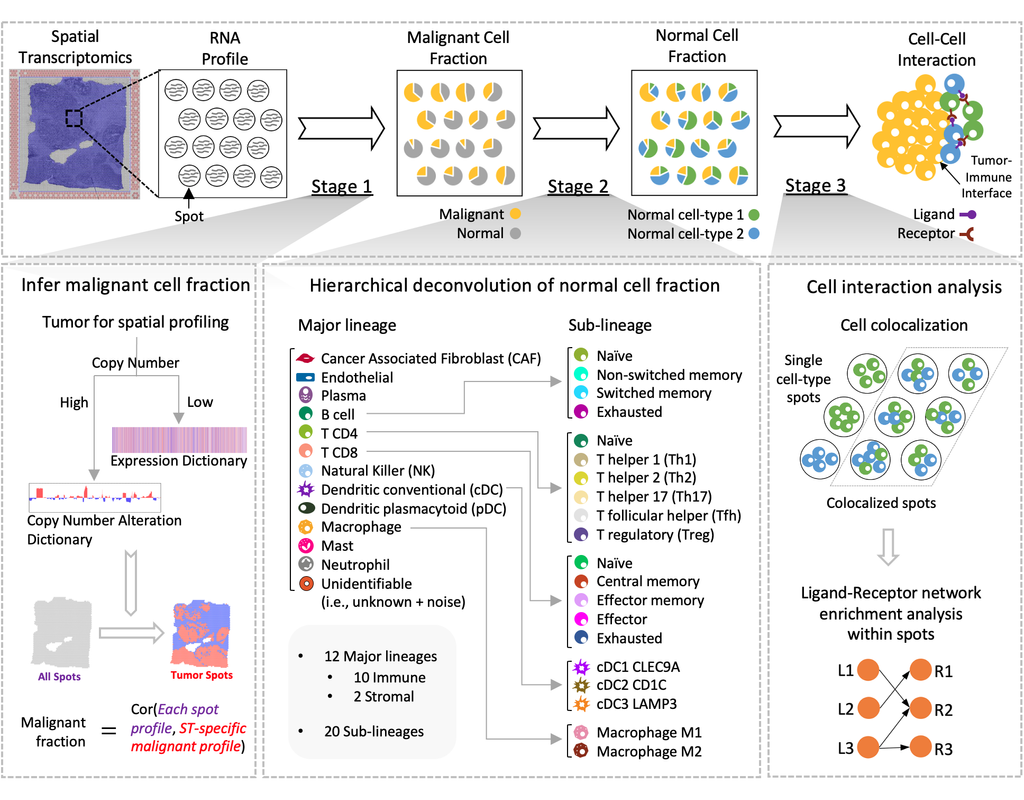
Spatial transcriptomics (ST) technology has allowed to capture of topographical gene expression profiling of tumor tissues, but single-cell resolution is potentially lost. Identifying cell identities in ST datasets from tumors or other samples remains challenging for existing cell-type deconvolution methods.
Spatial Cellular Estimator for Tumors (SpaCET) is an R package for analyzing cancer ST datasets to estimate cell lineages and intercellular interactions in the tumor microenvironment. Generally, SpaCET infers the malignant cell fraction through a gene pattern dictionary, then calibrates local cell densities and determines immune and stromal cell lineage fractions using a constrained regression model. Finally, the method can reveal putative cell-cell interactions in the tumor microenvironment.
In this notebook, we will illustrate an example workflow for cell type deconvolution and interaction analysis on breast cancer ST data from 10X Visium. The notebook is inspired by SpaCET's vignettes and modified to demonstrate how the tool works on BioTuring's platform.
Trends
BioTuring
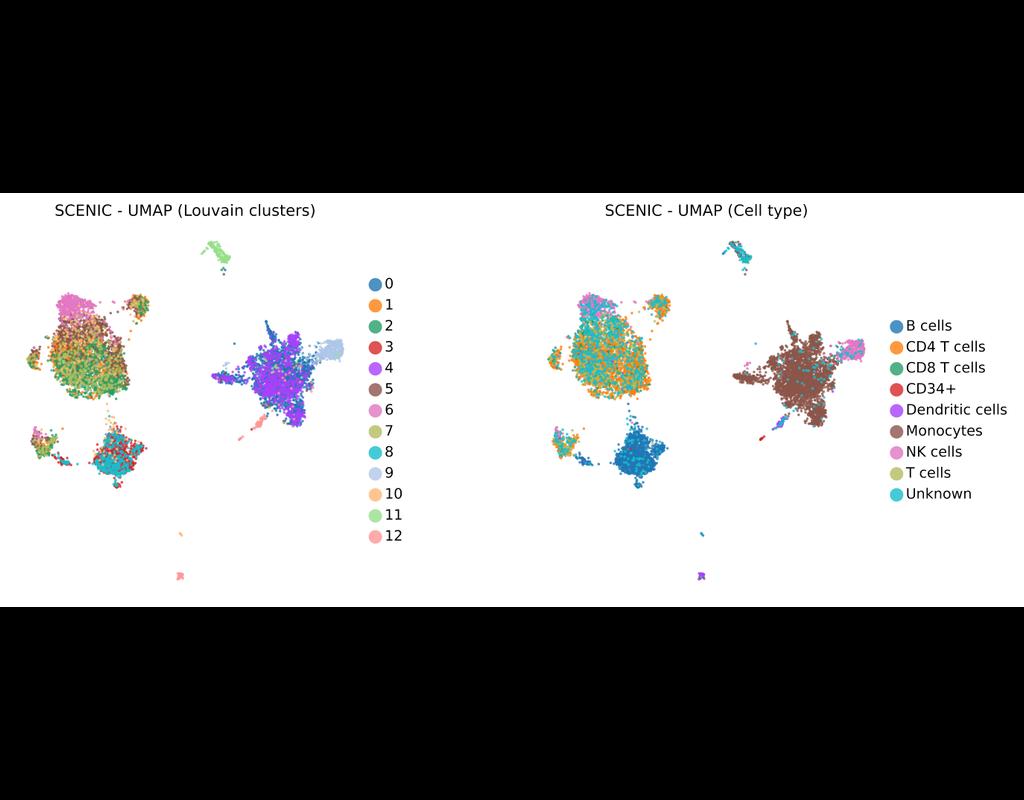
SCENIC Suite is a set of tools to study and decipher gene regulation. Its core is based on SCENIC (Single-Cell Regulatory Network Inference and Clustering) which enables you to infer transcription factors, gene regulatory networks and cell types from single-cell RNA-seq data.
pySCENIC is a lightning-fast python implementation of the SCENIC pipeline (Single-Cell Regulatory Network Inference and Clustering) which enables biologists to infer transcription factors, gene regulatory networks and cell types from single-cell RNA-seq data.